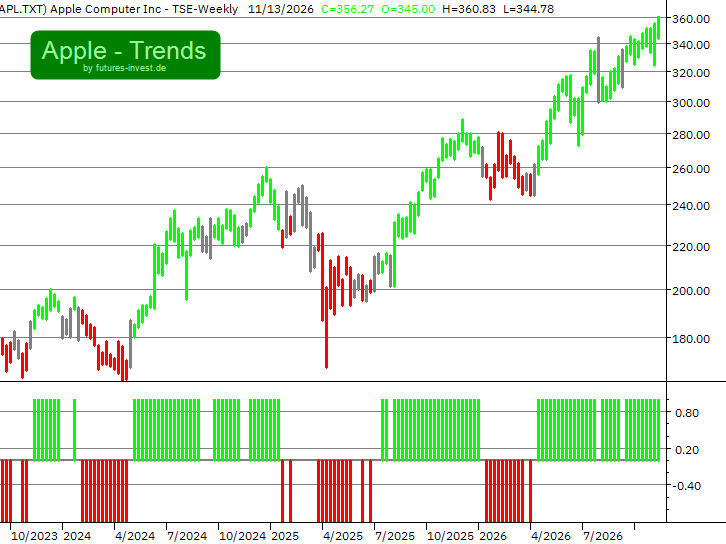
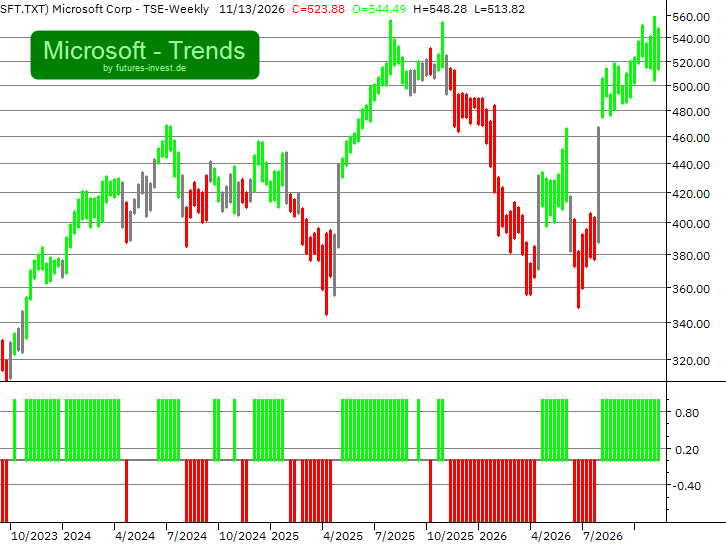
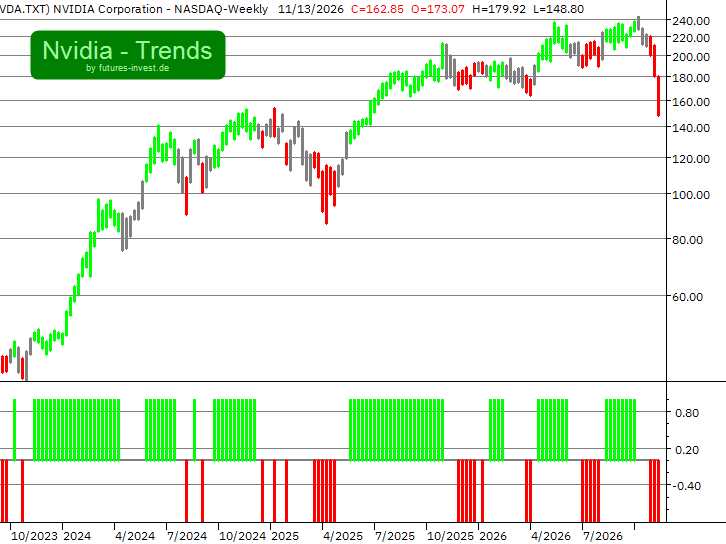
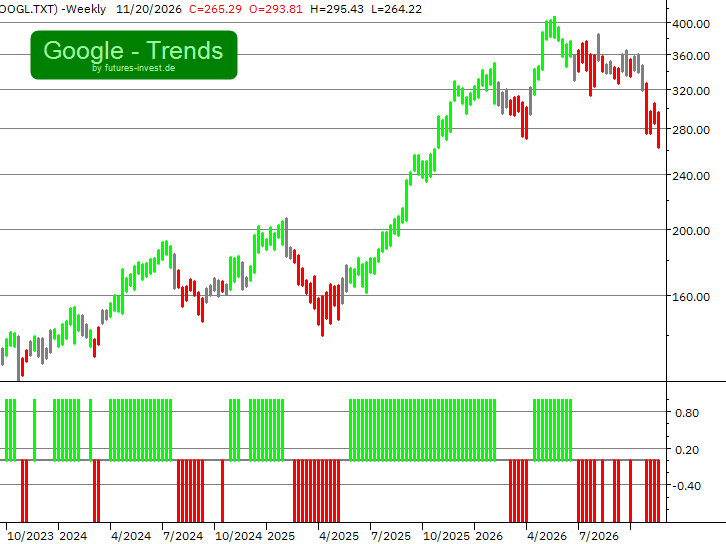
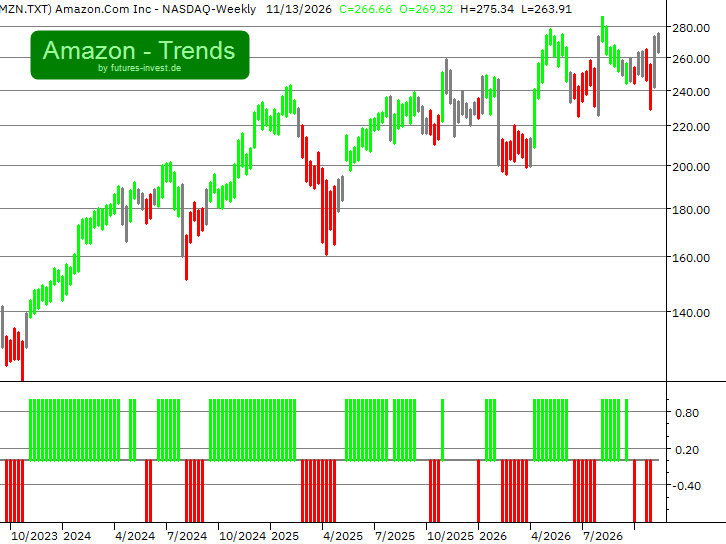
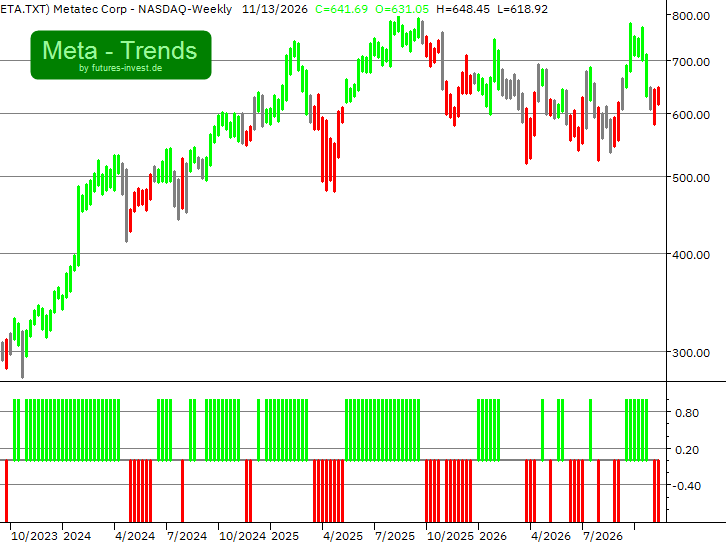
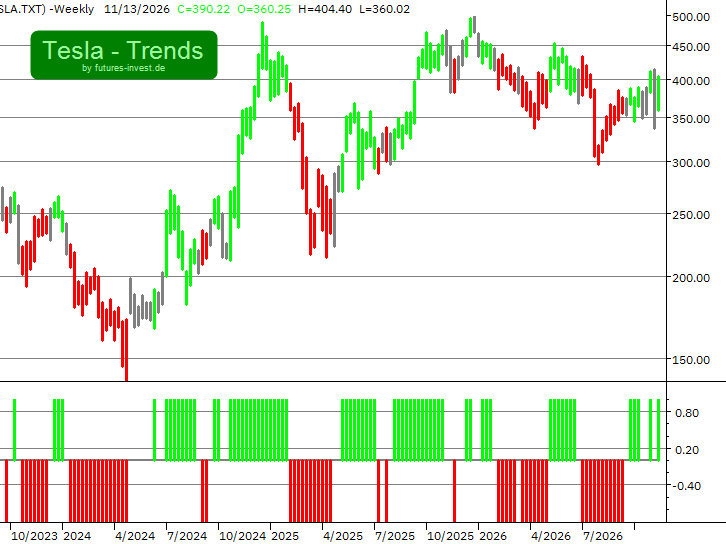
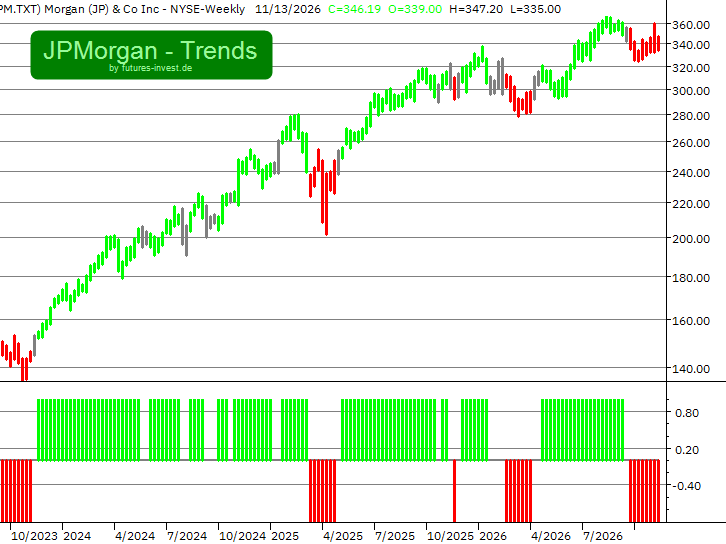
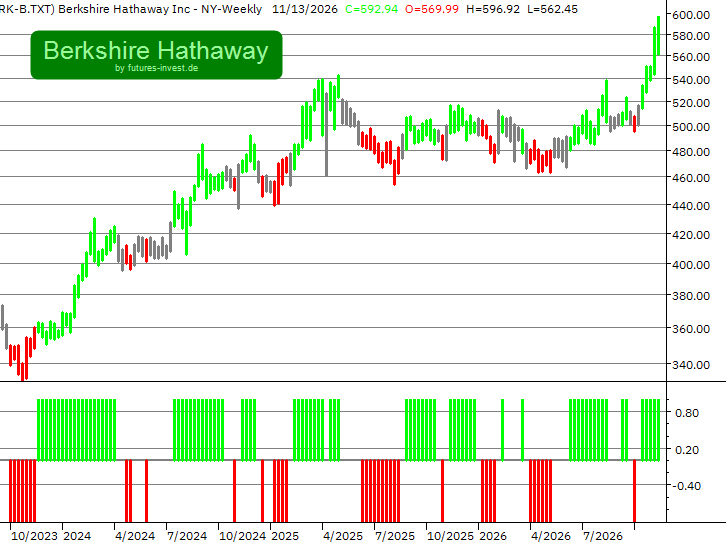
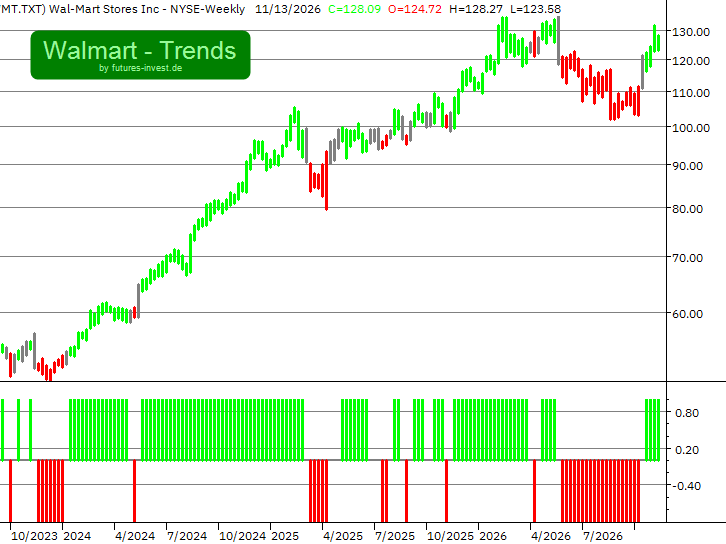
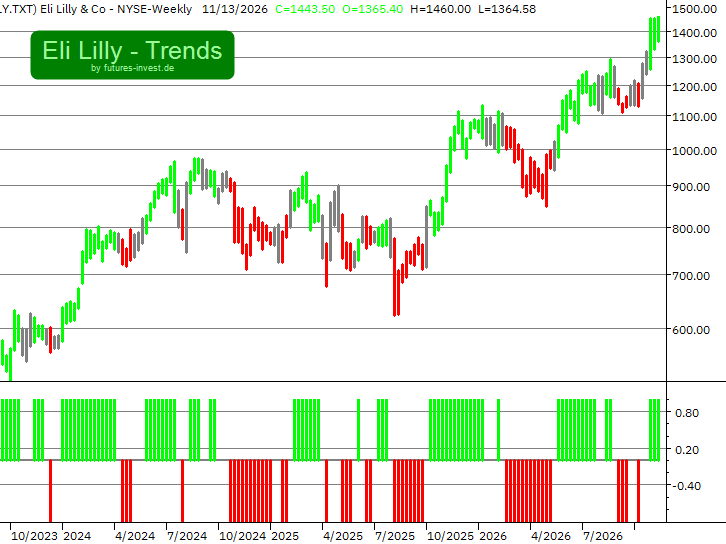
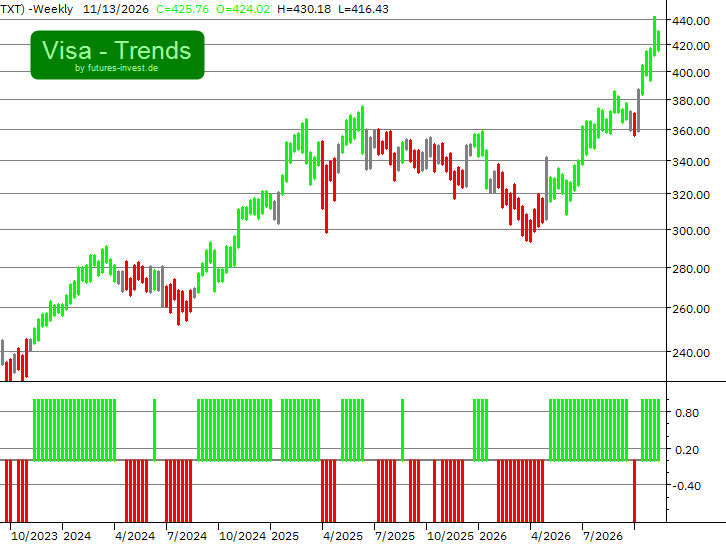
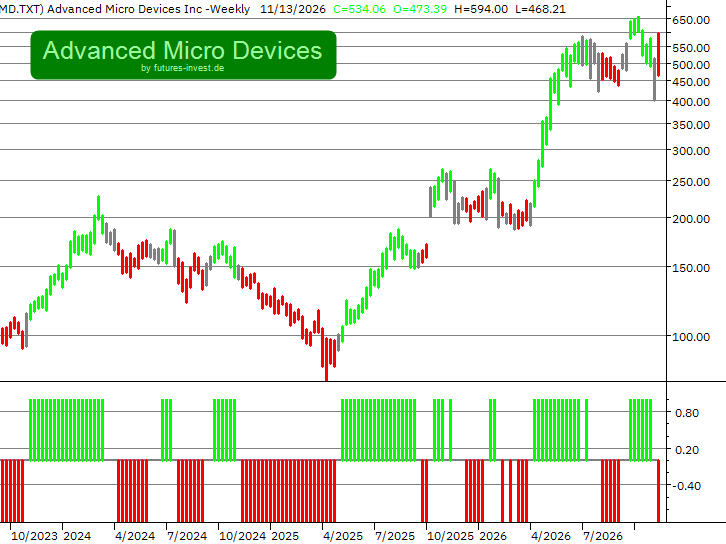
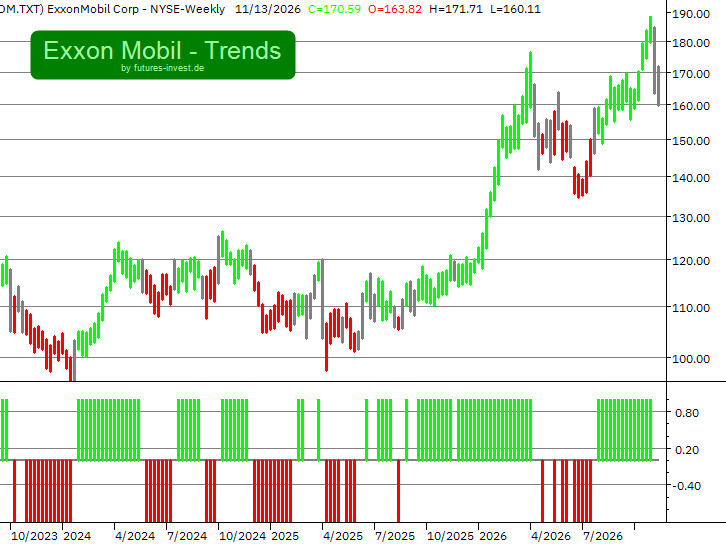
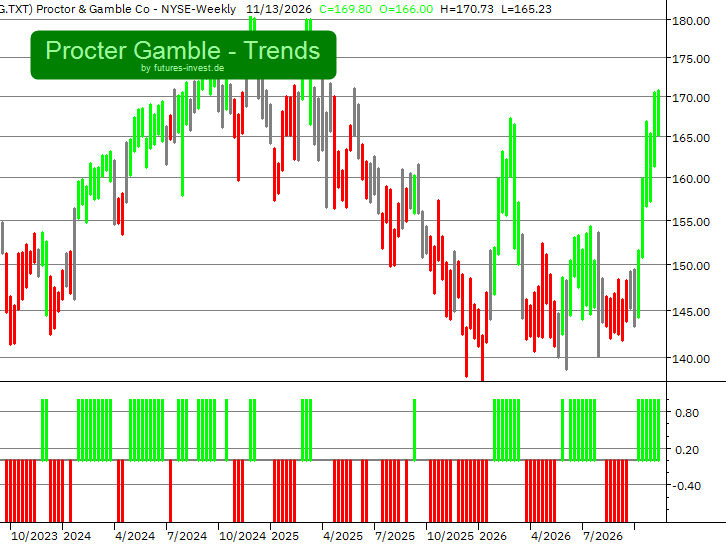
US Major Stocks: Forecast
Loading...
Select a stock above to view the current chart analysis.
What is Chart Analysis?
- Chart analysis, also known as technical analysis, is a method used to forecast future price movements of securities based on past price performance. It is based on the assumption that prices move in trends and that these trends will continue into the future.
- To perform a chart analysis, historical price data is examined in the form of charts. These charts can take various forms, such as line or bar charts. Using these charts, different indicators and patterns are identified, which can provide clues about future price movements and thereby help improve trading performance.
- Common indicators include, for example, moving averages, the Relative Strength Index (RSI), Bollinger Bands, and the MACD. These indicators provide insight into whether a security is overbought or oversold and whether a potential trend reversal is imminent.
- In addition, chart patterns are also analyzed, such as head-and-shoulders formations, triangles, or flags. These patterns can likewise provide signals regarding future price movements.
Note on Technical Analysis:
However, it is important to note that chart analysis does not offer absolute certainty regarding future price movements. Instead, it serves as a tool to calculate probabilities and make better-informed trading decisions. Overall, technical analysis is an essential instrument for traders and investors to understand market behavior and trade successfully. However, it should always be used in conjunction with risk management to build a balanced and successful trading portfolio.
Contact:
Show email
Share: